.png)
Americans seek control in the grocery aisle as affordability slips.
53% of Americans are more stressed about grocery prices than they were in January. This fall, the most craveable thing on the shelf may be the deal itself, and the flash of control that comes with catching it.
Last December, TikTok user @zoedippel created a viral sensation when she found something rather ordinary. It was a grocery receipt, normal in every sense, except for one: the haul was from 1997.
More than 400,000 users have liked the post, in which she compares the cost of popular items then against today’s prices. This video, and others like it, have fueled conversation around an affordability crisis that the Brand Joy Lab has studied throughout 2026.
Our data shows that 53% of people are more stressed about grocery prices now than at the start of the year. Meaning, since that receipt went viral, the gap between now and 1997 looks even wider.
Groceries have remained stressful throughout 2026
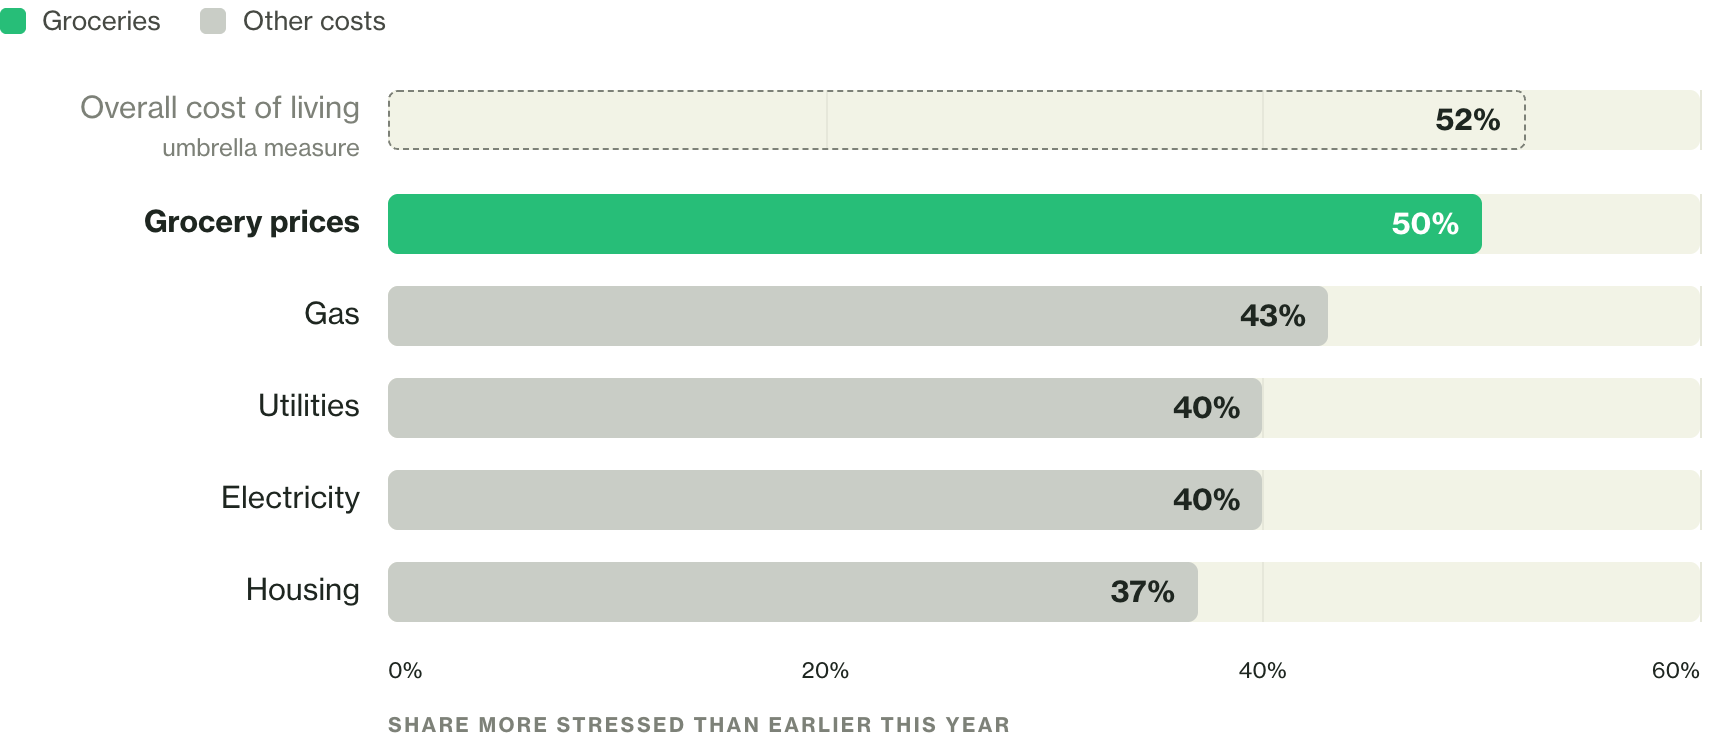
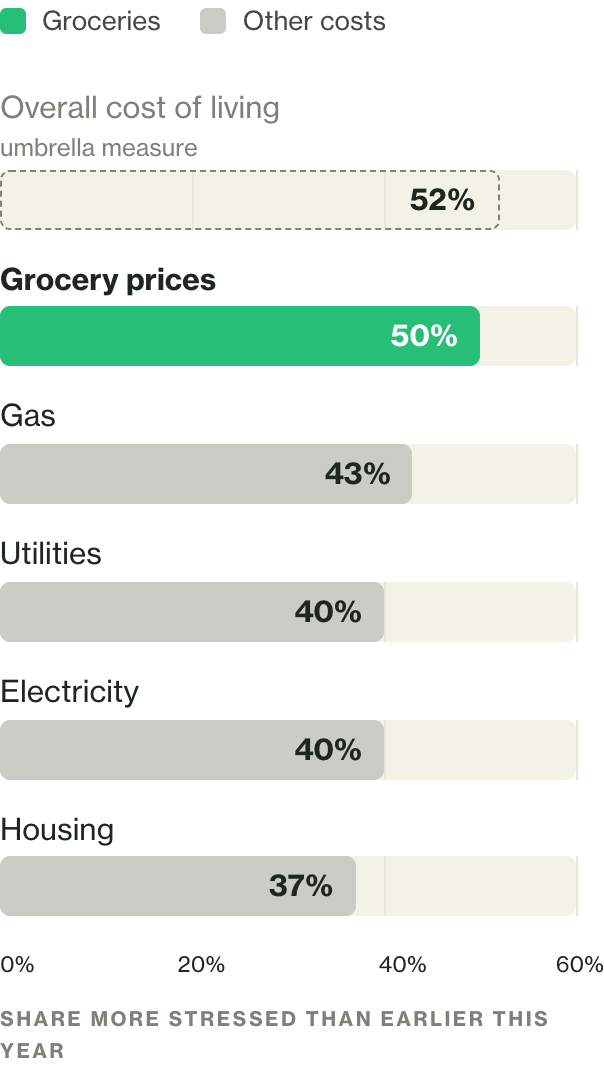
Share more stressed about each cost than earlier this year. Brand Joy Lab cost-stress tracker, pooled across six 2026 waves, n ≈ 2,520 per item. In September, the grocery reading was 53%.
There is, of course, another genre of receipt video. Because just as Americans are quick to bemoan the woes of high prices, they’re also proud to announce their hauls, which often come gilded with deals and finds.
The social media conversation echoes a quiet truth in our data: Just as we’re dissatisfied with high prices, our ability to maneuver around them provides us with a lot of pleasure. Brands gearing up for the holiday season push should know one thing.
What looks like thrift is really
something closer to control.
In Brand Joy Lab, we study the pleasure that people get from experiences, but we also measure how it influences behavior. We recently studied price-comparison behavior to understand how people are coping with inflation.
The comparing, the waiting, the pouncing, all of it is a person taking back the one variable in the trip they can still move.
Price-checking is the default
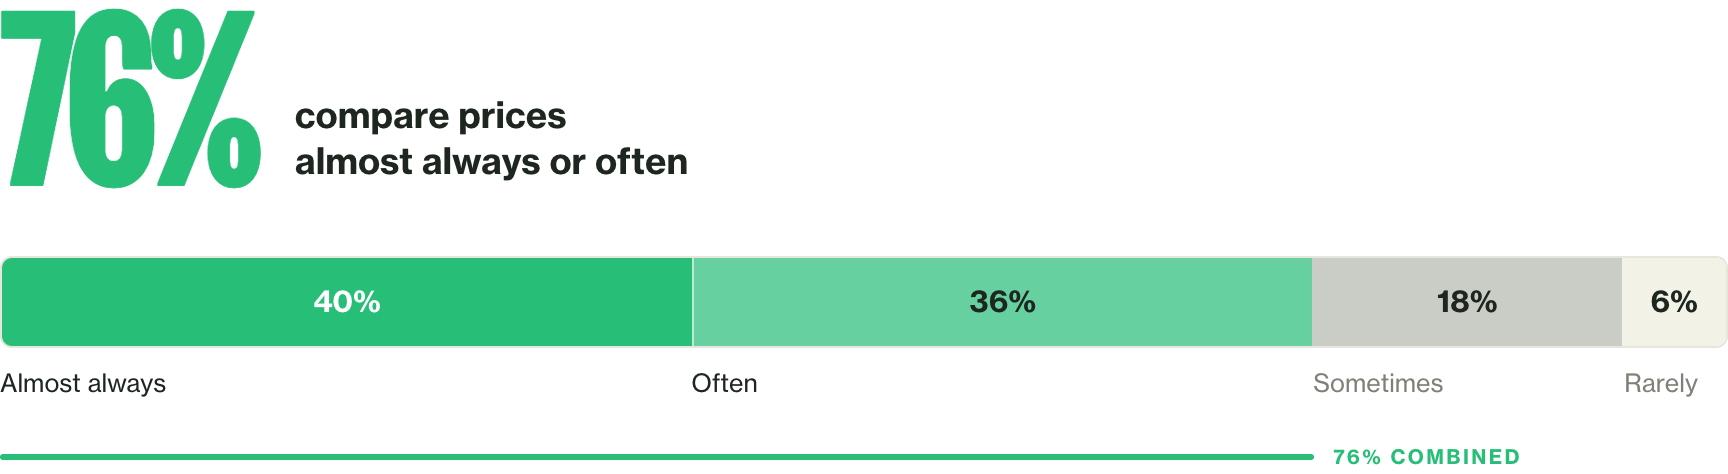
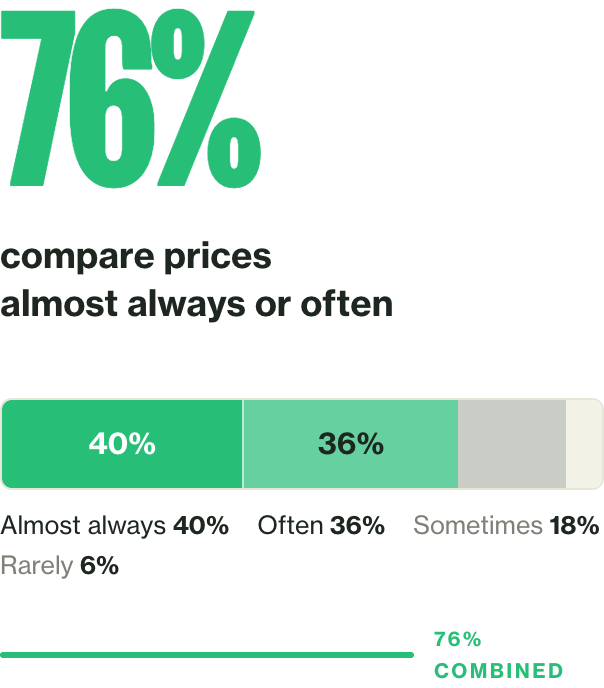
How often people compare prices before buying. Brand Joy Lab, August 2026 wave, n = 482.
Less than ten percent of people buy without comparing prices. That doesn’t mean that we’re always buying the cheapest option, however. When we see a good value, we treat it as an event. Many of us buy on the spot when we see a good deal.
Finding a deal is social
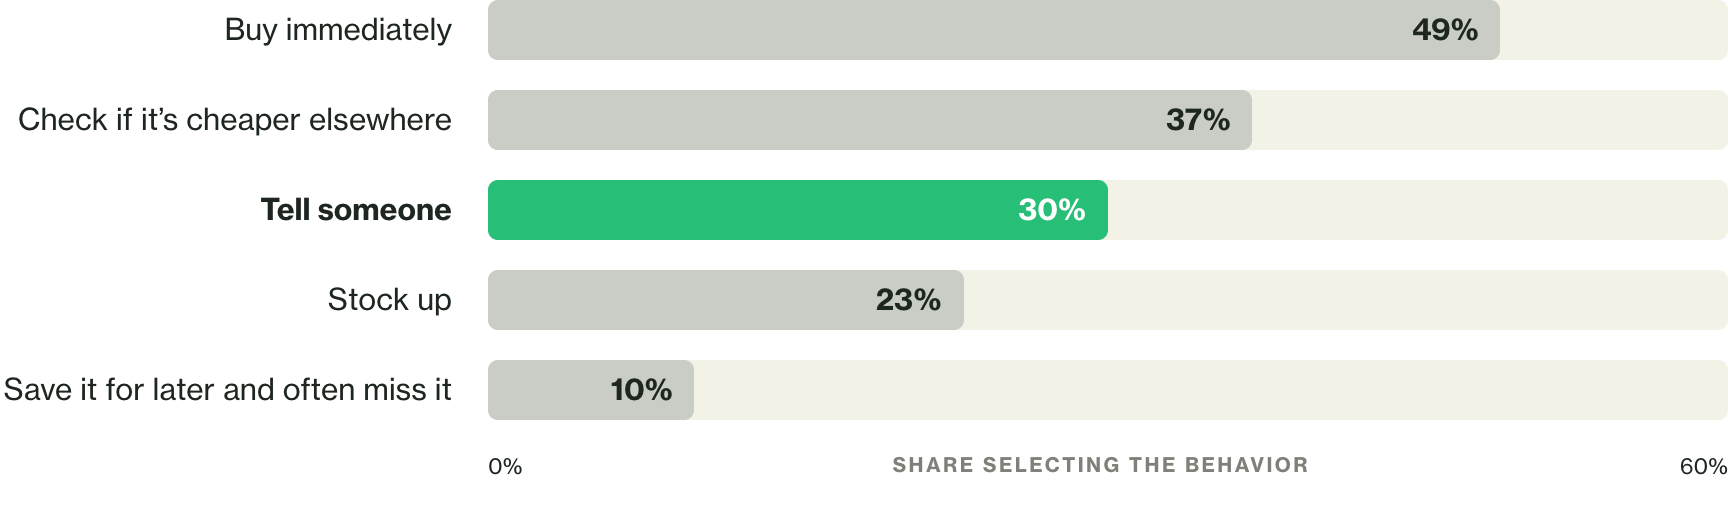
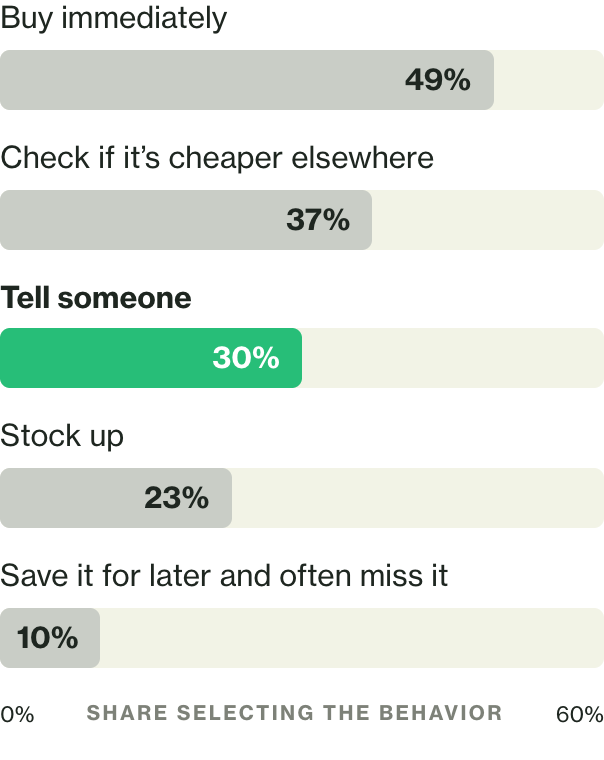
What people do when they find a great deal. Select-all, so shares do not total 100. Brand Joy Lab, August 2026 wave, n = 480.
Nearly a third of us go and tell a friend. Think about that behavior for a second, and then put yourself in the head of the consumer who feels compelled to reach out to someone when they find a deal. For nearly a third of Americans, finding value goes beyond self-preservation. These buyers seek to nourish their tribe by informing others of great value.
This behavior goes back further than our inflationary present. Americans just love their receipts. In fact, in measuring across all sorts of experiences, Brand Joy Lab finds consistently that people rate the act of getting a deal higher than a home-cooked meal, eating out, or ice cream.
The reason sits underneath the numbers. A meal is a pleasure. A deal is a victory, a small win of control in a season that keeps taking it away. Pleasure is nice, but control is a deeper emotional need.
It’s why the deal consistently wins.
The deal outscores the plate
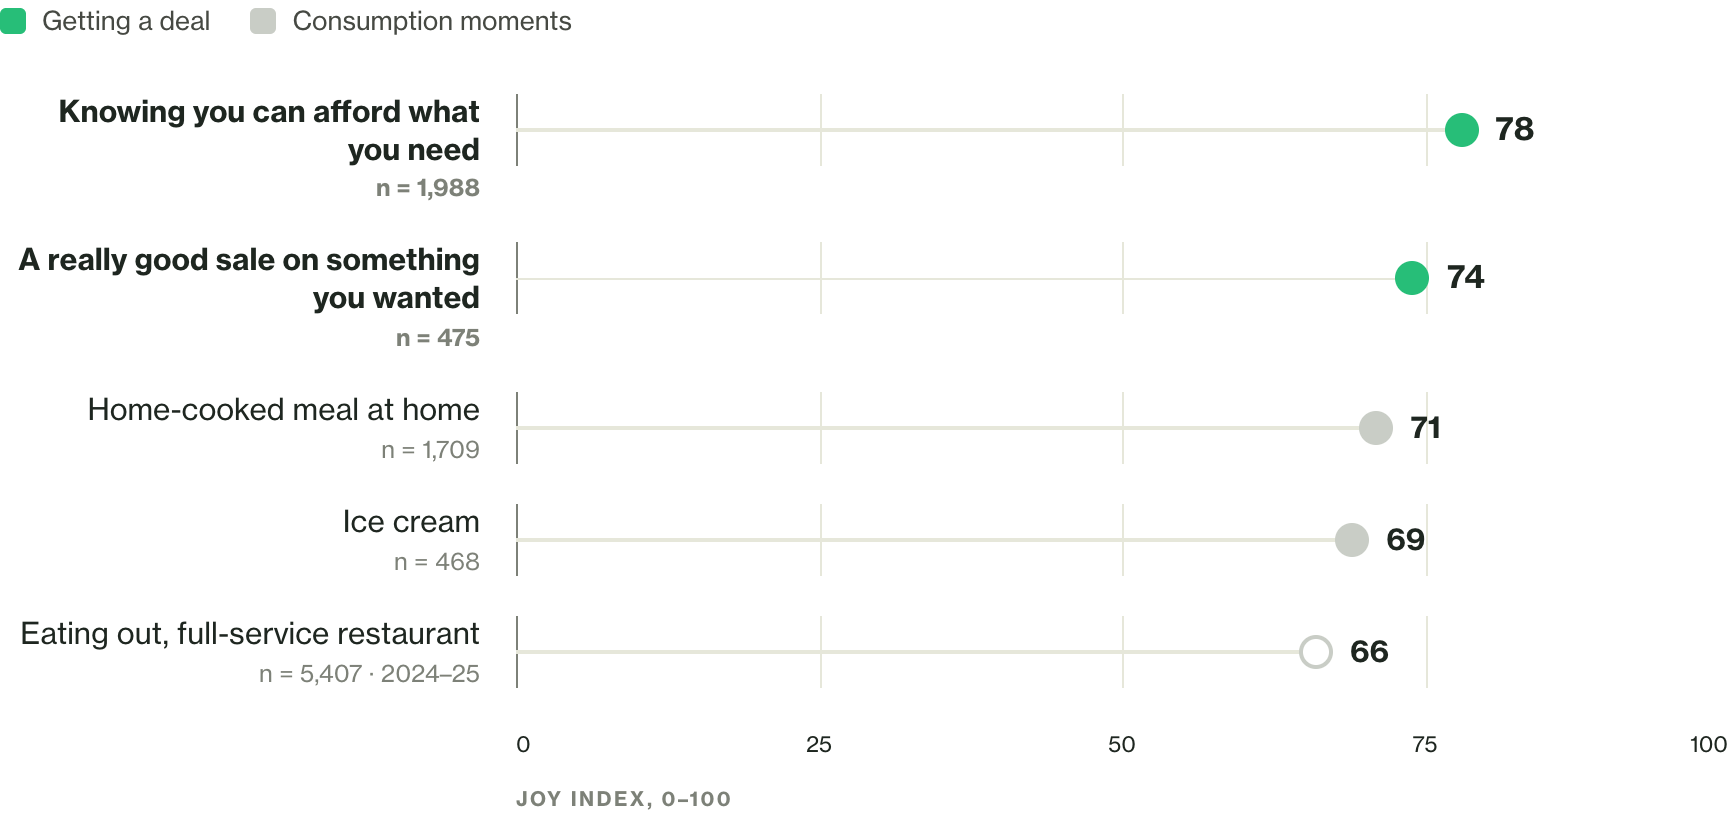
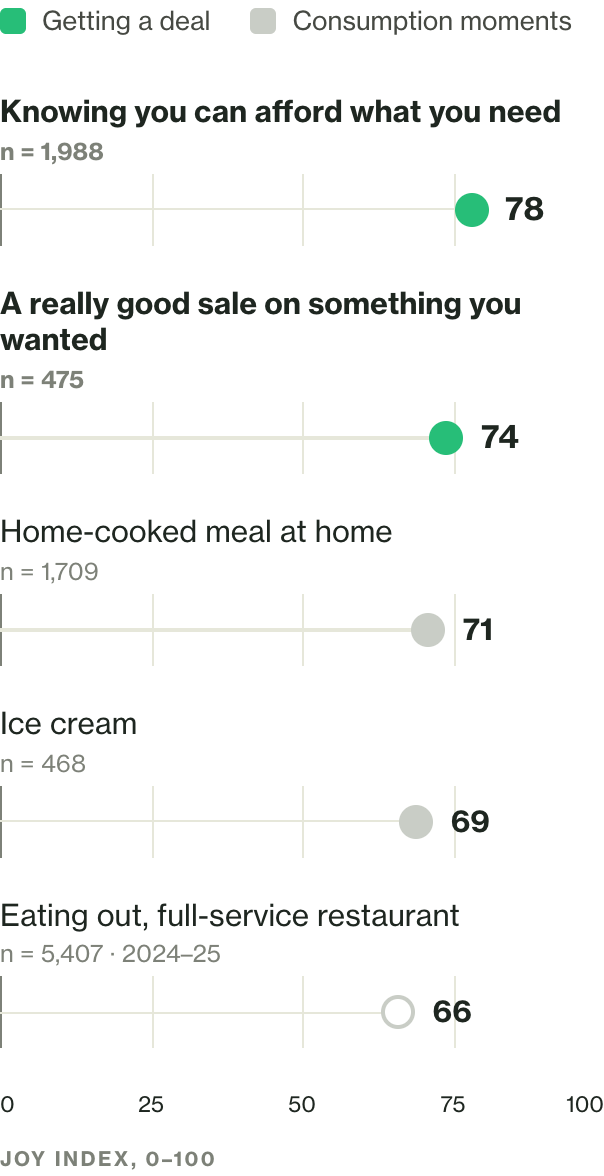
Joy Index, 0–100. Everyday-joy battery pooled 2024–2026; items fielded in different waves, per-item n ≈ 470–5,400. The hollow dot marks the one item read from an older window.
Hunting for a better value has become its own kind of joy. For some, it’s a necessity, and for others a sport. Dare we suggest it’s the real national pastime? (Finding a great deal does score 31 points higher than attending a baseball game on our Joy Index.)
Here is the good news for anyone who cannot afford to be the cheapest. Value is the one thing no one owns yet.
When we ask people to sort brands by what they stand for, the established names win the categories you would expect. They own high quality, and they own trust, both by wide margins. But good value splits down the middle, a near-perfect tie between the big names and the upstarts. Quality and trust are spoken for. Value is still open ground.
Value is the open ground
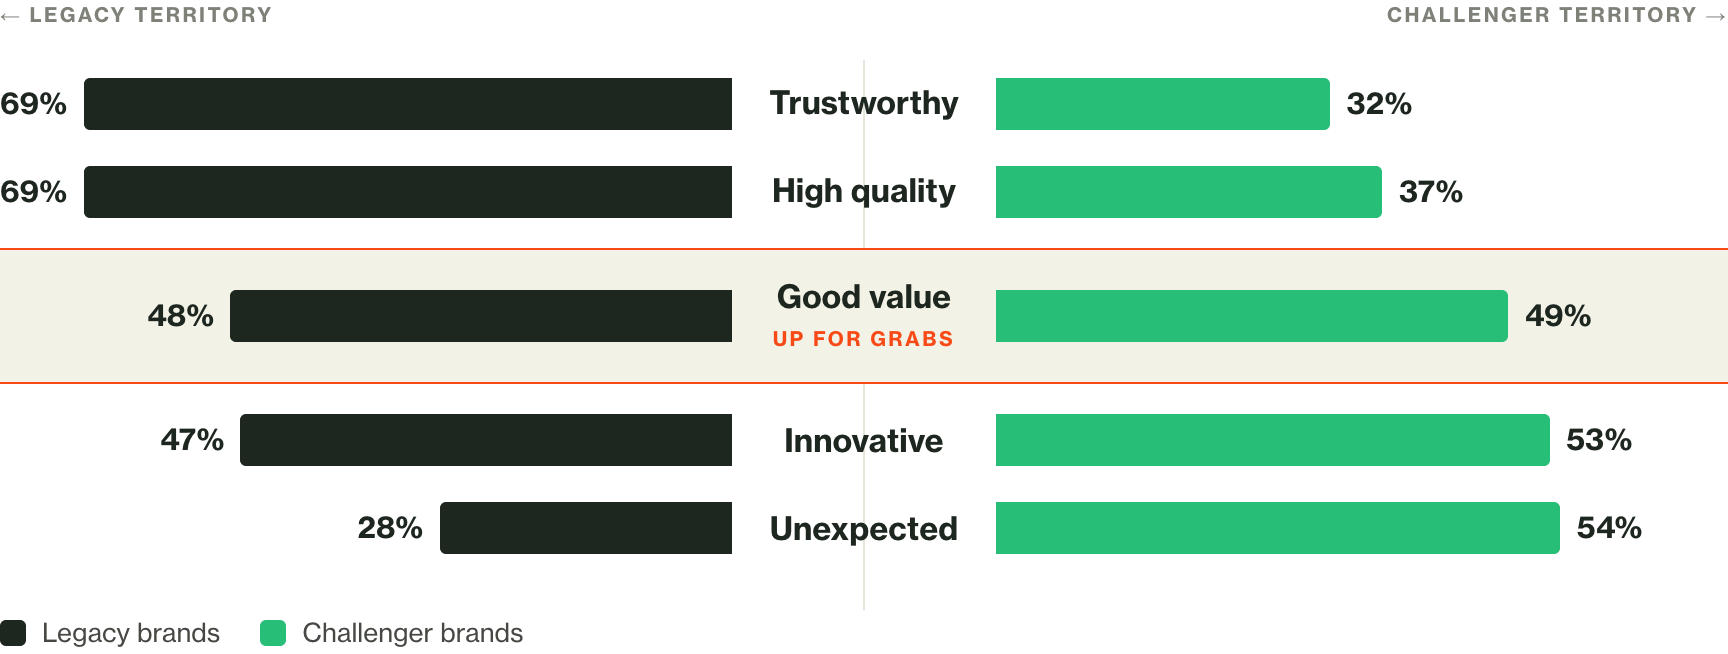
Share of respondents associating each attribute with each brand type. Multi-select, so bars do not sum to 100%. Brand-type association battery, May–June 2025, n ≈ 390. Brand types read as archetypes, not named brands.
That means two different ways to win, depending on who you are.
Make the trade an emotional win. If you are a challenger or a store brand, the win is already yours to take. People who choose the underdog tell us they feel a jolt of discovery, confidence in the choice they made, and a quiet sense of being smart about it. Those are the same feelings a good deal delivers. So do not apologize for being the cheaper option. Make choosing you feel like a find, the savvy move only the people paying attention would make. Trading down to you should feel like trading up in cleverness, not a concession.
Lean on your equity to justify your value. If you are an established brand, you already hold what the challengers are scratching for, quality and trust. The task is to turn that equity into value, so that when a shopper tightens up, you are the brand they keep instead of the one they leave behind. The difference is not small. A great deal on a brand people love lifts their joy well above their everyday baseline. A no-name downgrade drops it below. Same smaller basket, opposite feeling. Your job is to stay on the winning side of that line, to be the familiar name that still feels like a smart buy at a hard moment.
The brands that win this fall will not be the ones that cut their prices the deepest. They will be the ones that handed the shopper back a little control, and let them feel they beat the system rather than survived it. Everyone is watching the total at the bottom of the receipt. The brand that gets remembered is the one that made that number feel like a victory.
Give people that feeling, and you will not need the sale.
The tension is current. The cost-stress and price-behavior figures come from Brand Joy Lab tracking in 2026: the cost ladder pools January through September (n ≈ 2,520 per cost) and the deal-behavior figures are from the August wave (n ≈ 480–482).
The joy architecture is longitudinal. The experience rankings pool waves from 2024 through 2026, because how people rank these moments is a stable pattern. The brand-ownership map is from 2025, reported as shares of respondents, and reads brand types as archetypes rather than named brands. Comparisons appear in plain points, not coefficients.
The receipts and hauls describe a public mood, offered as context. The @zoedippel engagement figure is a claim about the original post, not a panel measure.
Cite as: Brand Joy Lab, PETERMAYER. September 2026.
Want the deal to feel like a win?

